제8회 전국동시지방선거 R 시각화·분석 R-based visualization and analysis of Korea's 8th local election (June 2022)
![]()
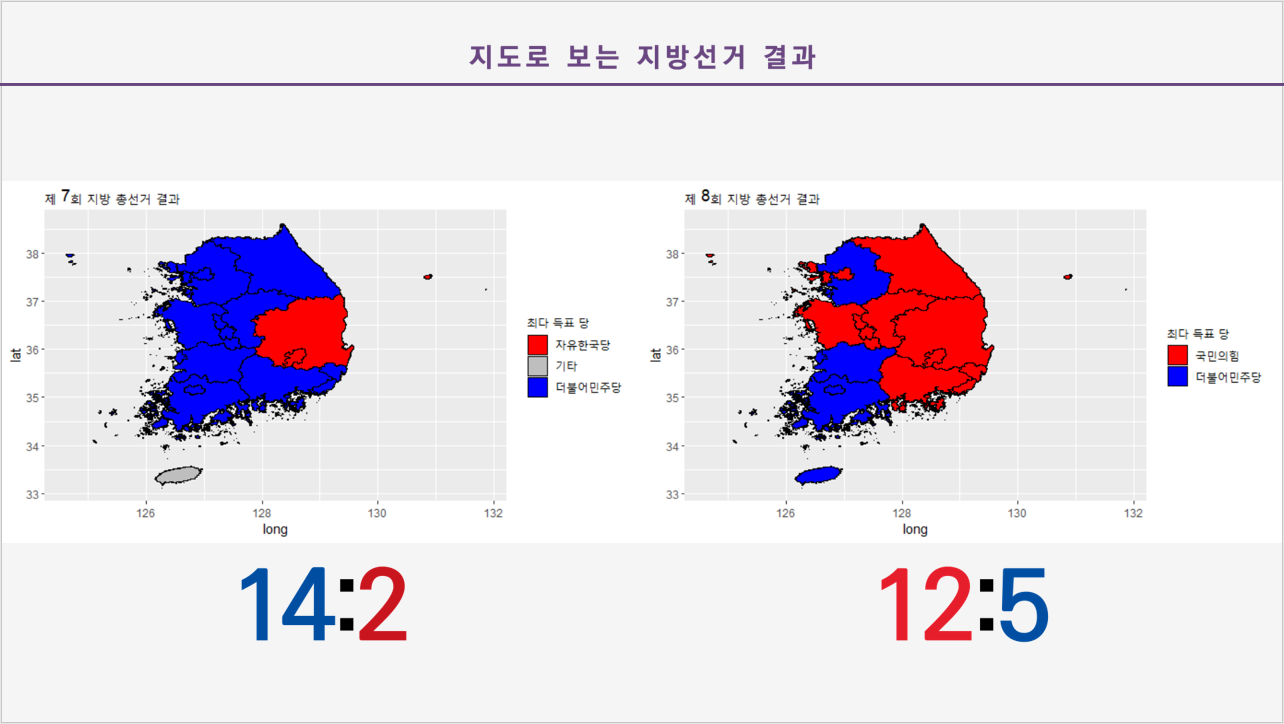
2022년 6월 1일 치러진 제8회 전국동시지방선거 결과를 R로 시각화·분석한 프로젝트
시·도별 정당 득표율을 한국 행정구역 shapefile에 매핑해 단계구분도(choropleth map)로 그리고, 직전 제7회 지방선거(2018) 및 제20대 대통령선거(2022.03)와의 표심 변화· 상관관계를 함께 살펴봅니다.
| 스크립트 | 산출물 |
|---|---|
src/07_local_election_map.R |
7회 지선 시·도 단계구분도 |
src/08_local_election_map.R |
8회 지선 시·도 단계구분도 |
src/presidential_local_correlation.R |
20대 대선 ↔ 8회 지선 / 7회 ↔ 8회 시·도별 상관계수 + 회귀선 |
src/regional_party_support_trend.R |
17개 시·도별 양당 7회 → 8회 득표율 변화 막대그래프 |
src/vote_share_by_gender_age.R |
8회 출구조사 성별·연령대별 정당 득표율 버블 차트 (원 크기 = 투표율) |
src/other_elected_officials_ratio.R |
기초자치단체장 · 광역의회의원 · 기초의회의원 당선자 정당 비율 7회·8회 비교 3D 파이차트 |
모든 그림은 실행 시 figures/에 PNG 로 저장됩니다.
- 언어: R
- 시각화:
ggplot2,gridExtra,plotrix(3D 파이차트), 기본 그래픽 (symbols,plot,abline) - 공간 데이터:
raster+sp—data/shapefiles/ctp_rvn.shp(시·도 행정경계) 로드 및+proj=longlat재투영 - 통계: 기본
lm/cor(회귀·상관분석) - 유틸:
here(저장소 루트 기준 상대경로)
- 중앙선거관리위원회 선거통계시스템 (info.nec.go.kr) — 7회·8회
지방선거, 제20대 대통령선거 시·도별 득표율 (
data/*.csv) - 국가공간정보포털 — 시·도 행정경계 shapefile (
data/shapefiles/ctp_rvn.*)
.
├── src/
│   ├── _helpers.R                         # 공용 로딩·저장 유틸 + 17개 시·도 상수
│   ├── 07_local_election_map.R            # 7회 지선 단계구분도
│   ├── 08_local_election_map.R            # 8회 지선 단계구분도
│   ├── presidential_local_correlation.R   # 대선·지선 상관성
│   ├── regional_party_support_trend.R     # 시·도별 양당 지지율 변화
│   ├── vote_share_by_gender_age.R         # 성별·연령대별 득표율
│   ├── other_elected_officials_ratio.R    # 기초/광역의회의원 당선자 비율
│   └── run_all.R                          # 모든 스크립트를 차례로 실행
├── data/
│   ├── 07_local_vote_share.csv            # 7회 지선 시·도별 양당 득표율
│   ├── 07_local_other_vote_share.csv      # 7회 기초/광역 당선자 정당 비율
│   ├── 08_local_vote_share.csv
│   ├── 08_local_other_vote_share.csv
│   ├── 08_local_male_age_vote_share.csv   # 8회 남성 연령대별 득표율
│   ├── 08_local_female_age_vote_share.csv # 8회 여성 연령대별 득표율
│   ├── 20th_presidential_vote_share.csv   # 20대 대선 시·도별 득표율
│   └── shapefiles/                        # 시·도 행정경계 (.shp/.shx/.dbf/.prj 4종)
│       └── ctp_rvn.*
├── figures/                               # 실행 시 자동 생성 (gitignored)
└── docs/
    └── presentation.pptx                  # 발표 슬라이드
# 1) 필요 패키지 설치 (최초 1회)
Rscript -e 'install.packages(c("here", "ggplot2", "raster", "sp", "plotrix", "gridExtra"))'

# 2) 모든 분석 실행 — figures/ 아래 PNG 생성
Rscript src/run_all.R

# 또는 RStudio 에서 개별 스크립트 실행:
#   setwd("/path/to/korea-local-election-2022")
#   source("src/08_local_election_map.R")
이 프로젝트는 raster::shapefile() 만 사용하므로 CRAN에서 retired된
rgeos / maptools 는 필요하지 않습니다. 장기적으로는 sf 기반
마이그레이션이 권장됩니다.
- 발표 슬라이드:
docs/presentation.pptx
R-based visualization and analysis of the 8th Korean local election held on June 1, 2022.
Maps province-level vote shares onto Korean administrative shapefiles as choropleths, and compares them with the previous 7th local election (2018) and the 20th presidential election (March 2022) to track regional vote-pattern shifts and correlations.
| Script | Output |
|---|---|
src/07_local_election_map.R |
7th local choropleth |
src/08_local_election_map.R |
8th local choropleth |
src/presidential_local_correlation.R |
Pearson r + regression for 20th-presidential vs 8th-local and 7th vs 8th local |
src/regional_party_support_trend.R |
Province-level 7th → 8th vote-share delta bars |
src/vote_share_by_gender_age.R |
8th exit-poll bubble chart by gender × age (bubble size = turnout) |
src/other_elected_officials_ratio.R |
3D pies of party mix for mayors / provincial council / municipal council across 7th vs 8th |
All figures are written to figures/ on run.
- Language: R
- Visualization:
ggplot2,gridExtra,plotrix(3D pies), base graphics (symbols,plot,abline) - Spatial:
raster+sp— loadsdata/shapefiles/ctp_rvn.shpand reprojects to+proj=longlat - Statistics: base
lm/cor - Utility:
here(repo-relative paths)
- National Election Commission Election Statistics System (info.nec.go.kr) — 7th / 8th local + 20th presidential province-level vote shares (
data/*.csv). - National Spatial Data Infrastructure Portal — province administrative shapefile (
data/shapefiles/ctp_rvn.*).
.
├── src/
│   ├── _helpers.R                         # shared loader/saver utils + 17-province constant
│   ├── 07_local_election_map.R            # 7th choropleth
│   ├── 08_local_election_map.R            # 8th choropleth
│   ├── presidential_local_correlation.R   # presidential-local correlation
│   ├── regional_party_support_trend.R     # province-level party-support delta
│   ├── vote_share_by_gender_age.R         # gender × age bubble chart
│   ├── other_elected_officials_ratio.R    # mayor / council 3D pies
│   └── run_all.R                          # runs every script in order
├── data/                                  # preprocessed CSVs + province shapefile bundle
├── figures/                               # generated on run (gitignored)
└── docs/presentation.pptx                 # presentation deck
# 1) Install required packages (first time only)
Rscript -e 'install.packages(c("here", "ggplot2", "raster", "sp", "plotrix", "gridExtra"))'

# 2) Run all analyses — writes PNGs under figures/
Rscript src/run_all.R

# Or run individual scripts in RStudio:
#   setwd("/path/to/korea-local-election-2022")
#   source("src/08_local_election_map.R")
The project only uses raster::shapefile(), so the CRAN-retired
rgeos / maptools packages are not required. A migration to sf
is the recommended longer-term direction.
- Presentation slides:
docs/presentation.pptx