Accurate analysis of qPCR data using global fitting
qPyCR was developed based on the 2012 publication titled 'Robust Quantification of Polymerase Chain Reactions Using Global Fitting' by Dr. Sean D. Moore and Anna Carr: https://doi.org/10.1371/journal.pone.0037640
The original software implementation of the global fitter was developed for the University of Central Florida by Bioinformatics.org for online use and can be found here: http://www.bioinformatics.org/ucfqpcr/
qPyCR is an open source (GPL) implementation written in Python 2.7 by Andrew Kettring.
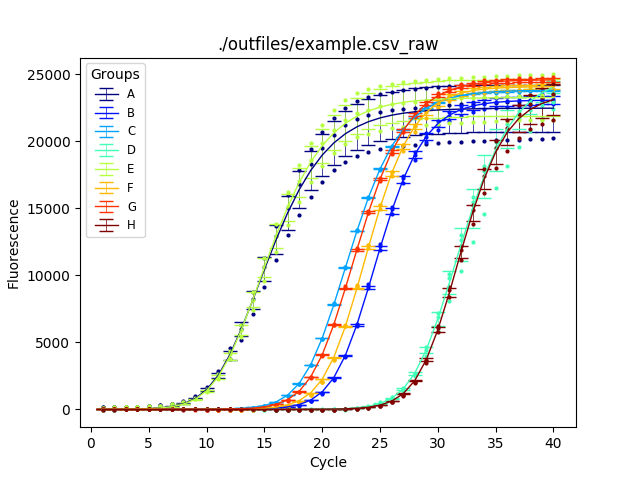
This version features an improvement in the fitting algorithm not described in the manuscript. Each series is normalized in the range of [0,1] prior to calculating seed values. In theory, a series should never exceed 1, the maximum amount of PCR product. To accomplish this each series is treated accordingly:
- Fit the un-transformed "raw" series to estimate Kd, seed, and max.
- Estimate the limit that the series approaches by forward-casting 80-100 cycles.
- Use this limit value to set the maximum value for [0,1] transformation of the input data.
- Re-fit the new transformed series.
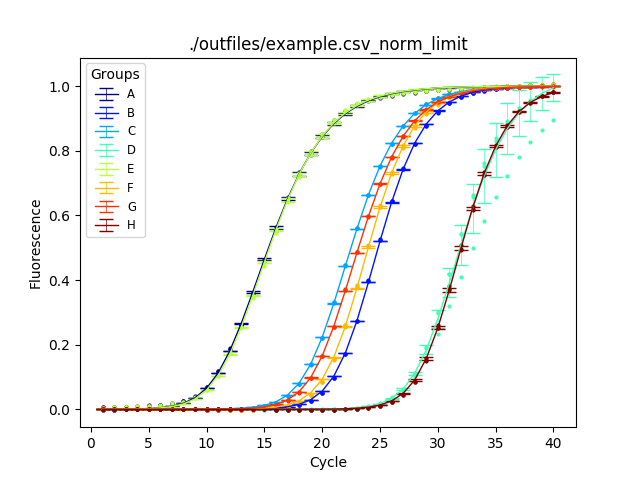
- Wave goodbye to error bars!
Before normalization:
After normaliztion:
qPyCR requires the installation of the Python 2.7 and the following modules: numpy, scipy, pandas, and matplotlib.
Example input data is provided with the source code.
qPyCR accepts '.csv' formatted fluorescence data from qPCR reactions.
The .csv sheet should contain a 'Cycle' column.
Subsequent reaction columns are grouped based on their headers.
Column headers should be labeled as -, without spaces or special characters.
The source installation directory contains two '.py' files and two folders labeled ./infiles/ and ./outfiles/.
Place the properly formatted '.csv' file in the ./infiles/ directory.
Open a shell and navigate to the source installation directory.
Here's the basic usage example:
> python2 `qPyCR.py -f example.csv`
For more information on usage options:
 > python2 `qPyCR.py --help`

 usage: qPyCR.py [-h] [-f FILENAME] [-i INDIR] [-o OUTDIR] [-n NORMALIZE]
                [-w WEIGHT] [-c CYCLES]

 optional arguments:

  -h, --help            show this help message and exit

  -f FILENAME, --file FILENAME
                        --file=<your-file.csv>

  -i INDIR, --in_dir INDIR
                        directory for incoming files, default = ./infiles/

  -o OUTDIR, --out_dir OUTDIR
                        directory for outgoing files, default = ./outfiles/

  -n NORMALIZE, --norm NORMALIZE
                        limit (default), max, global

  -w WEIGHT, --weight WEIGHT
                        if True, use weighting function in fitting

  -c CYCLES, --cycles CYCLES
                        Number of cycles for fit
Output files are generated in the ./outfiles/ directory and are labeled according to their input file (example.csv-*):
norm_ : Normalized output based on user input (default: limit) raw_ : Non-normalized output
stats : Initial seed , max, and Kd values fit : Global abundance fits for each curve modeled by these values
_group : Grouped stats/fit based on column headers. Stats include means and standard deviations for each group. Fits are generated from the mean of the stats.
*.png/pdf : Graphical output of abundance fits from matplotlib