Heatmaps are a powerful but underappreciated way to visualize timeseries. This package uses tidyquant to fetch data and ComplexHeatmap to make a clustermap. Any transformation desired can be applied to the data, from tidyquant or otherwise. Along the way, timeseries are converted to xts format and NA values are conveniently handled.
To get the current development version from github:
# install.packages("devtools")
devtools::install_github("akettring/marketmapR")
This project is geared toward categorizing sp500 stocks comprehensively. Other equities can be used too.
symbol_list <- tq_index("SP500")$symbol # %>% sample(50)    # all sp500 equities
df <- tq_get(symbol_list, from = "2020-12-01")              # date range : YTD
Downloading data can take time, so save/load the file for convenience.
write.table(df, file = "demo/sp500.tsv", row.names=FALSE, sep="\t")
df <- read.delim("demo/sp500.tsv", header=TRUE, sep="\t") %>% as_tibble()
df$date <- df$date %>% as.Date()
Use the tq_mutate function to append technical indicators to the original dataframe.
https://business-science.github.io/tidyquant/articles/TQ01-core-functions-in-tidyquant.html
df_plot <- df %>%
    na.omit(target.colnames="close") %>%                    # filter missing values
    group_by(symbol) %>%                                    # sort by symbol
    tq_mutate(                                              # technical indicator
        select = close,                                     # value to transform
        mutate_fun = RSI)
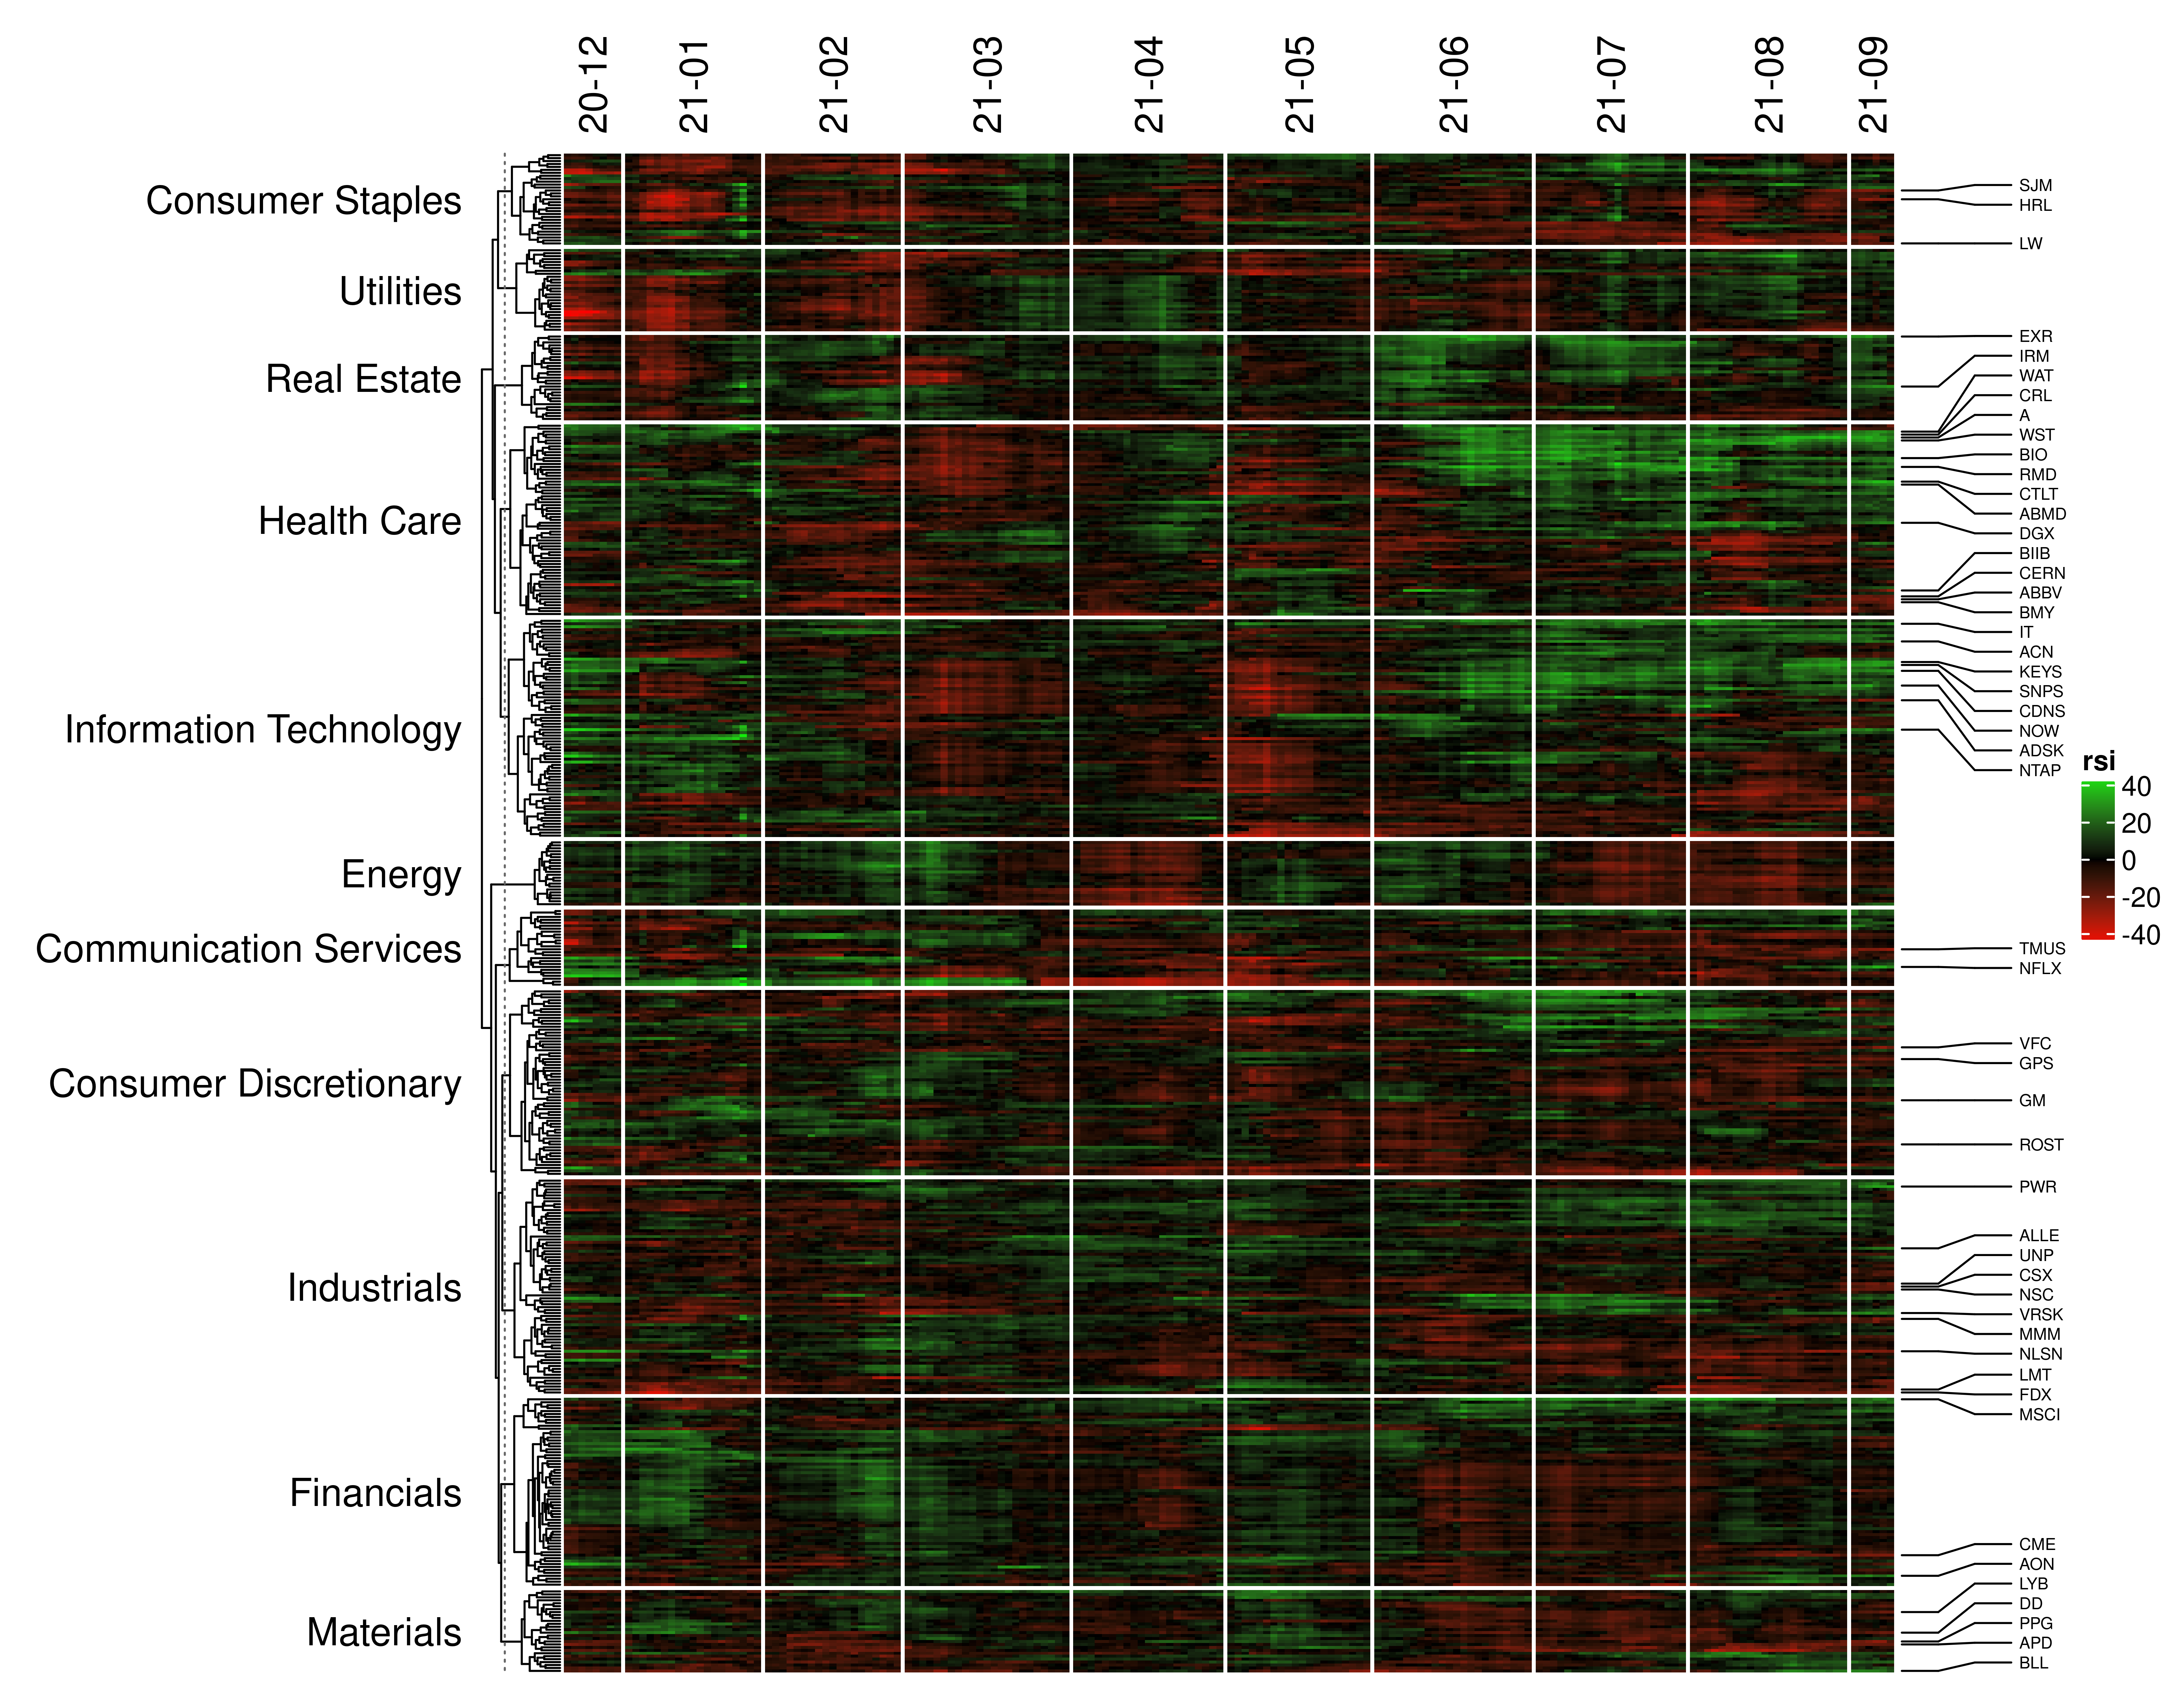
The market_map function needs columns: date, symbol, and the indicated valvar.
market_map(df_plot,
           valvar = "rsi",          # if valvar isnt defined, the last column in the df is used
           n_labels = 25,           # how many labels?
           n_top = 5,               # length of tail to consider for sorting labels
           label_at = "both",       # label both the top and bottom performing stocks
           group_idx = "sp500",     # for mapping non-sp500 equities, use "combo" (<50 stocks) or NULL (>50 stocks)
           detrend = TRUE           # removing baseline market shifts can sometimes make trends more clear
)
Copyright (C) 2021 Andrew Kettring
This program is free software: you can redistribute it and/or modify it under the terms of the GNU General Public License as published by the Free Software Foundation, either version 3 of the License, or (at your option) any later version.
This program is distributed in the hope that it will be useful, but WITHOUT ANY WARRANTY; without even the implied warranty of MERCHANTABILITY or FITNESS FOR A PARTICULAR PURPOSE. See the GNU General Public License for more details